Introduction
늘 SemanticKITTI만 사용하다가, KITTI-360을 사용할 일이 생겼다. 그래서 데이터셋을 다운 받았는데, 생각보다 SemanticKITTI와 다른 포맷을 지닌 게 아닌가? 특히나 각 cloud point에 해당하는 label은 없고, submap 형태로 label을 제공해줘서 좀 당혹스러웠다. 그래서 point-wise로 semantic label을 어떻게 하면 할당할 수 있는지 이것저것 시도하다가, 그 방법을 기록해보고자 한다.
Dataset 구조
.
├── data_3d_bboxes
│   └── train
├── data_3d_raw
│   ├── 2013_05_28_drive_0000_sync
│   │   ├── velodyne_points
│   │   └── velodyne_points_labeled
│   ├── 2013_05_28_drive_0002_sync
│   │   └── velodyne_points
│   ├── 2013_05_28_drive_0003_sync
│   │   └── velodyne_points
│   ├── 2013_05_28_drive_0004_sync
│   │   └── velodyne_points
│   ├── 2013_05_28_drive_0005_sync
│   │   └── velodyne_points
│   ├── 2013_05_28_drive_0006_sync
│   │   └── velodyne_points
│   ├── 2013_05_28_drive_0007_sync
│   │   └── velodyne_points
│   ├── 2013_05_28_drive_0009_sync
│   │   ├── velodyne_points
│   │   │   └── data
│   │   └── velodyne_points_labeled
│   └── 2013_05_28_drive_0010_sync
│       └── velodyne_points
├── data_3d_semantics
│   └── train
│       ├── 2013_05_28_drive_0000_sync
│       │   ├── dynamic
│       │   └── static
│       ├── 2013_05_28_drive_0002_sync
│       │   ├── dynamic
│       │   └── static
│       ├── 2013_05_28_drive_0003_sync
│       │   ├── dynamic
│       │   └── static
│       ├── 2013_05_28_drive_0004_sync
│       │   ├── dynamic
│       │   └── static
│       ├── 2013_05_28_drive_0005_sync
│       │   ├── dynamic
│       │   └── static
│       ├── 2013_05_28_drive_0006_sync
│       │   ├── dynamic
│       │   └── static
│       ├── 2013_05_28_drive_0007_sync
│       │   ├── dynamic
│       │   └── static
│       ├── 2013_05_28_drive_0009_sync
│       │   ├── dynamic
│       │   └── static
│       └── 2013_05_28_drive_0010_sync
│           ├── dynamic
│           └── static
└── data_poses
    ├── 2013_05_28_drive_0000_sync
    ├── 2013_05_28_drive_0002_sync
    ├── 2013_05_28_drive_0003_sync
    ├── 2013_05_28_drive_0004_sync
    ├── 2013_05_28_drive_0005_sync
    ├── 2013_05_28_drive_0006_sync
    ├── 2013_05_28_drive_0007_sync
    ├── 2013_05_28_drive_0008_sync
    ├── 2013_05_28_drive_0009_sync
    ├── 2013_05_28_drive_0010_sync
    └── 2013_05_28_drive_0018_sync
데이터셋 구조는 위와 같다. 여기서 data_3d_semantics가 꽤나 특이하게 구성되어 있었다.
예로 들어서, data_3d_semantics 내의 한 sequence인 2013_05_28_drive_0009_sync를 열어보면 아래와 같이 되어 있는 것을 볼 수 있다:
0000000002_0000000292.ply  0000003972_0000004258.ply  0000009195_0000009502.ply
0000000284_0000000460.ply  0000004246_0000004489.ply  0000009489_0000009738.ply
0000000451_0000000633.ply  0000004475_0000004916.ply  0000009727_0000010097.ply
0000000623_0000000787.ply  0000004905_0000005179.ply  0000010086_0000010717.ply
0000000778_0000001026.ply  0000005156_0000005440.ply  0000010703_0000011118.ply
0000001005_0000001244.ply  0000005422_0000005732.ply  0000011099_0000011363.ply
0000001234_0000001393.ply  0000005719_0000005993.ply  0000011351_0000011646.ply
0000001385_0000001543.ply  0000005976_0000006285.ply  0000011630_0000011912.ply
0000001534_0000001694.ply  0000006272_0000006526.ply  0000011896_0000012181.ply
0000001686_0000001961.ply  0000006515_0000006753.ply  0000012167_0000012410.ply
0000001951_0000002126.ply  0000006740_0000007052.ply  0000012398_0000012693.ply
0000002117_0000002353.ply  0000007038_0000007278.ply  0000012683_0000012899.ply
0000002342_0000002630.ply  0000007264_0000007537.ply  0000012876_0000013148.ply
0000002615_0000002835.ply  0000007524_0000007859.ply  0000013133_0000013380.ply
0000002826_0000003034.ply  0000007838_0000008107.ply  0000013370_0000013582.ply
0000003026_0000003200.ply  0000008096_0000008413.ply  0000013575_0000013709.ply
0000003188_0000003457.ply  0000008391_0000008694.ply  0000013701_0000013838.ply
0000003441_0000003725.ply  0000008681_0000008963.ply
0000003712_0000003987.ply  0000008953_0000009208.ply
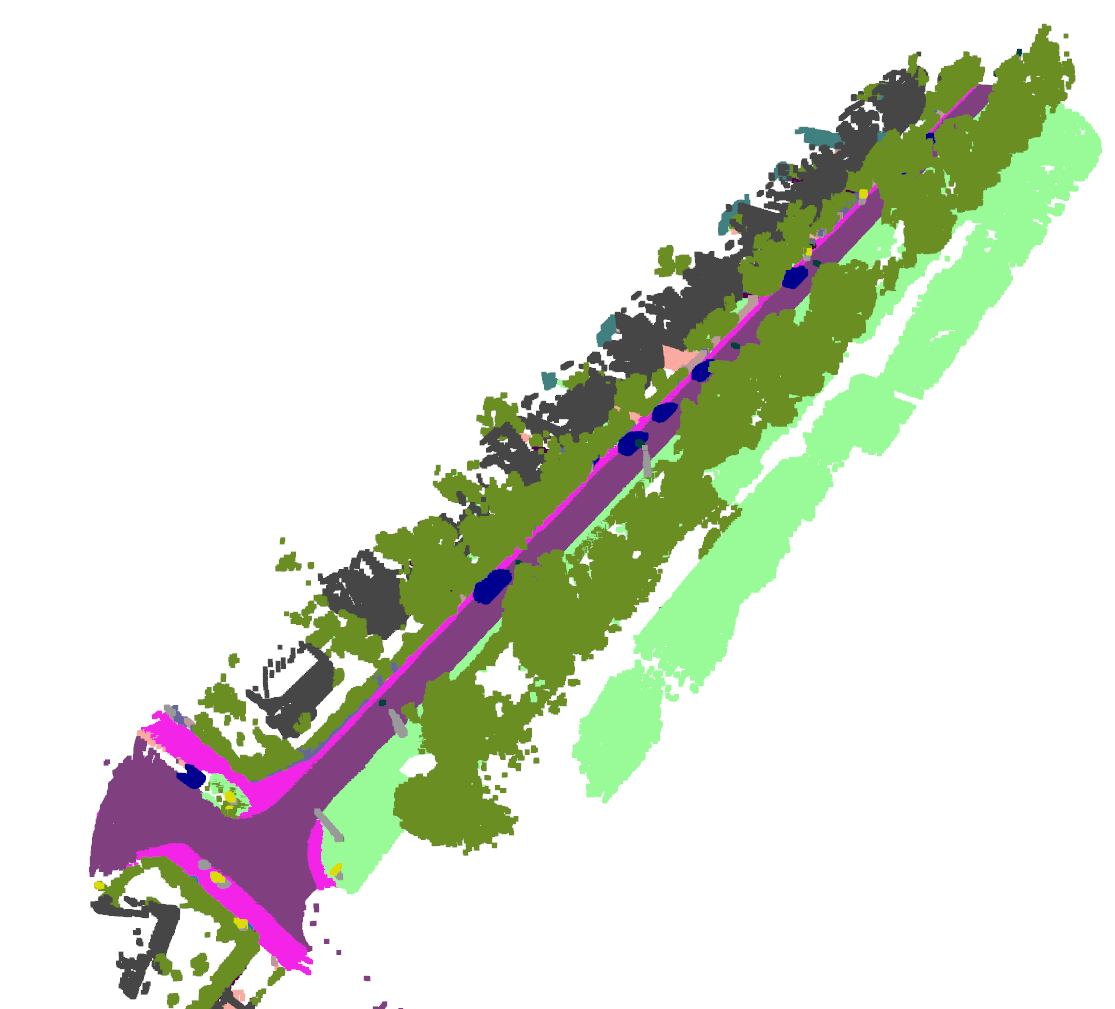
즉, N개의 point cloud가 주어지면, N개의 대응되는 label 파일을 제공하는 게 아니라, 데이터셋을 제작할 때 쓴 submap의 label을 그냥 제공하는 것을 볼 수 있었다.
아래는 0000000002_0000000292.ply 파일을 visualization한 예시이다:

(Colormap의 정보는 여기 helper folder 내를 보면 확인할 수 있다)
How To Parse
원 저자들이 제공하던 코드가 version 이슈로 segmentation fault error가 발생해서, 현재 이 코드에 돌아가게 고쳐두었다 혹시 KITTI-360을 돌려야 하는 이는 이를 참고하길 바란다. 불러 오는 것은 아래 코드처럼 하면 저 submap을 불러올 수 있는데:
data = read_ply(pcdFile)
points=np.vstack((data['x'], data['y'], data['z'])).T.astype(np.float64)
color=np.vstack((data['red'], data['green'], data['blue'])).T
pcd = open3d.geometry.PointCloud()
pcd.points = open3d.utility.Vector3dVector(points)
pcd.colors = open3d.utility.Vector3dVector(color.astype(np.float32)/255.)
위의 코드에서 data를 print("Keys in data:", data.dtype.names)와 같이 출력해보면 아래와 같이 출력되는 것을 볼 수 있다:
Keys in data: ('x', 'y', 'z', 'red', 'green', 'blue', 'semantic', 'instance', 'visible', 'confidence')
여기서 우리에게 중요한 것은 semantic 정보와 instance 정보를 추출해내는 것인데, 위의 instance 값을 “global 값”이라고 부르는 것 같다.
이 global 값을 우리가 원하는 값으로 파싱하기 위해서는 아래와 같이 시행해야 한다:
MAX_N = 1000
def local2global(semanticId, instanceId):
    globalId = semanticId*MAX_N + instanceId
    if isinstance(globalId, np.ndarray):
        return globalId.astype(np.int64)
    else:
        return int(globalId)

def global2local(globalId):
    semanticId = globalId // MAX_N
    instanceId = globalId % MAX_N
    if isinstance(globalId, np.ndarray):
        return semanticId.astype(np.int64), instanceId.astype(np.int64)
    else:
        return int(semanticId), int(instanceId)
결론
우리는 각 scan의 pose를 알기 때문에
1) scan과 submap을 같은 좌표계로 transformation을 해준 후,
2) scan의 각 i번째 point를 query로 submap을 target clode로 지정 후, Nearest neighbor search를 해서
3) submap의 point와 대응되는 global instance 값을 global2local 함수로 파싱해서
4) scan의 i번째에 해당하는 semantic 정보로 위의 int(semanticId)를 채워주면 끝!